Q-talk 138 - Nov/Dec 2009 - index


- Details
- Category: Q-Talk Index
- Published: Wednesday, 23 December 2009 16:24
- Written by Doug Humble
- Hits: 3487
 | Quickie Builders Association Together we build better planes! Nov./Dec. 2009 Issue Number 138 |
IT'S CALLED "DECALAGE"
A preliminary study of the influence of relative incidence between wing and canard (decalage) on flight characteristics of the Q-2xx.
By Jay Scheevel, Grand Junction, CO
Introduction
For many years I have had a pet theory that the range of cruise and landing speeds observed in the flying Q-2xx's are primarily the result of variations in relative incidence angles between the wing and canard (decalage angle). We know that in order for these aircraft to fly and fly well, the two flying surfaces must work together optimally. Our starting assumption is that a Q-2xx built to match QAC plans is optimized in this respect. Those of us who are building or have built a Q-2xx also know that the QAC plans' method for precise installation of the wing-canard incidence leaves much to be desired (Basically: "glue a flat board on each and use a bubble level to check"). I have, over the years procrastinated and avoided gluing my wings onto my fuselage primarily because of my curiosity/ apprehension about the impact of decalage angle on flying qualities of my plane-to-be. I finally decided to do something concrete about answering my own questions, so I built a tool that would very precisely measure the angle of incidence on wings and canards on flying Q-2xx's. The measurement methodology allows me to compare these flying Q measurements directly to the QAC plan templates in order to determine the exact deviation of the measured aircraft from plan-specified level lines. I then set out to measure a bunch of planes starting with the October 2009 FOD fly-in in Beatrice. I asked the owners of the fine aircraft that I measured to be so kind as to do some calibrated flight testing and send me these results. All of the owners of the planes I measured were kind enough to do these flight tests promptly and to send me the results. I thank them for their willingness to do this. The following is a report of my observations and my analysis to date.
The Tool
The incidence angle measuring tool is relatively simple. It consists of a masonite template (that fits over the leading edge of each wing) and a pivoting metal yardstick. The yardstick (pivot-arm) has a fixed pin that fits into a bushed hole in a metal yoke that is itself bolted to the masonite template. The pivot-arm has a movable standoff that slides along the yardstick/pivot-arm and rests at a single point on either the top or bottom of the wing. When in place on the wing, the assembly causes the yardstick to sit at a fixed angle relative to horizontal. The tool angle is measured with a digital level/inclinometer from a "SmartLevel" digital leveling tool rigidly mounted in a housing that is attached to the pivot arm. The tool is accurate to angles plus or minus 0.05 degrees. Figure 1 below, shows the entire tool assembly in the process of measuring an angle on the bottom of the main wing at BL100.
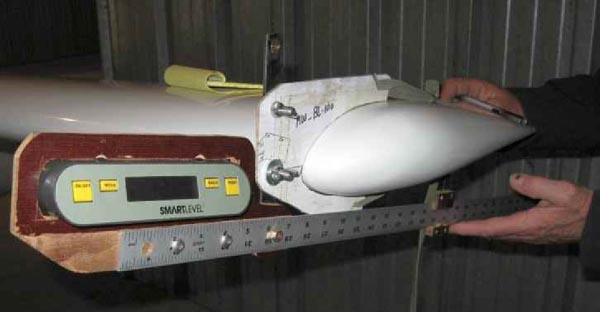
Figure 1. Angle-measuring tool set up to measure angles on bottom of the main wing.
Figure 1. Angle-measuring tool set up to measure angles on bottom of the main wing.
The metal yoke has two fixed studs that can be removed and attached with wing nuts to any of several templates that are designed to fit wing and canard (both LS-1 and GU) airfoils. The metal yoke has two bushing positions. One on the top and one on the bottom of the yoke so as to accommodate the pivot arm assembly, depending on whether to tool is measuring on the top or the bottom of the airfoil.
The slide on the yardstick/pivot arm allows for many measurements to be made along the chord from front to back. By combining many measurements on the top & bottom of the airfoil, an accurate, precise estimate of incidence angle can be made. Templates for both BL50 & BL100 were built, so that both stations could be measured on both left & right wings, but because of limited time at FOD-2009 and owing to the wide variety of BL100 configurations (wingtips, wheel pants, etc), only BL 50 measurements were taken. On several Q's measurements were only taken on either the right or the left side, not both, again due to limited time.
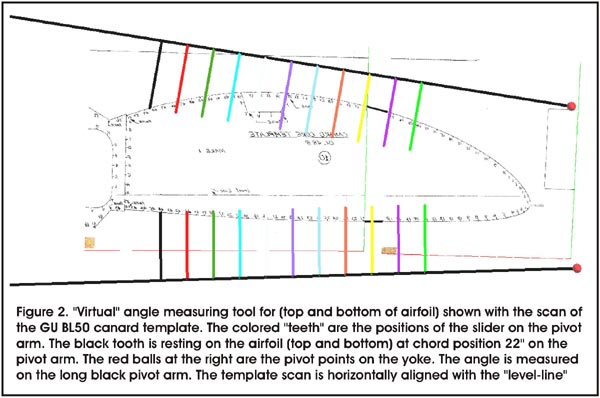
In order to compare the measurements from the various aircraft to the original templates, a "virtual" angle-measurement tool was also constructed within a 3D CAD computer program. The plan templates from my original set of QAC plans were scanned full-scale and loaded as images to the 3D computer model. The "virtual" tool was positioned in the yoke pivot positions and then measurements made the same way that was done on the actual Q's. The "virtual" tool and template are shown in Figure 2 below. Virtual angle measurements were made for the Main Wing, GU origina,l GU canard and the LS-1 new canard templates. So, with these measurements I am able compare any Q configuration to the original plans.
The Measurements
I was able to measure the wings and canards on 7 Q's at the FOD fly-in. Five of these aircraft were O-200 powered Q-200s (2) or Tri-Q 200s (3), one was a Jabiru 3300 powered Q-2 (GU canard) and one was a Type-4 VW powered Q-2 (LS-1 canard). My primary focus in this study was the relative incidence angle between wing and canard, so I made no effort to verify the angle of wings relative to the fuselage, Small variations in fuselage angles are not expected to significantly affect the performance, so I neglected this variation for now and focused only on the relative wing angles. I choose to describe the decalage angle as the incidence angle of the main wing relative to the canard using the QAC-plan's level-lines as reference. Decalage angle sign convention is defined as follows: Main wing leading edge upward is a positive decalage angle and main wing leading edge downward is negative. If the Q-2xx is built to exactly match the plans, then I would measure the decalage angle at zero degrees.
The seven aircraft that I measured at FOD 2009 exhibited decalage angles varying from -3.14 to +2.39. This is a range of 5.5 degrees (almost +/-3 degrees relative to the QAC plans). Although some builders have intentionally altered their decalage during construction, is seems that the QAC method for setting wing angle is difficult to execute consistently and can result in a wide range of decalage angles in finished aircraft. It is also worth noting that all of the aircraft at FOD 2009 have significant flight time, so we can safely assume that the range of measured decalage angles is within margins of safe operation for the Q-2xx design. In other words, an inexact match of the wing angles with respect to QAC plans nevertheless results in a plane that is manageable throughout the performance envelope.
To demonstrate reason for confidence in the measurements made with my tool, it is worth discussing the measurement method in a bit more detail. The measurements are made every inch from 12-22" along the tool-chord for both the top and the bottom of the airfoil for each template placement. The same measurements are performed on the plans templates using the "virtual" tool. In summary, a total of 24 measurements are used constrain a single estimated incidence angle for each BL on each wing. The need to measure both top and bottom at many stations is in order to provide enough redundancy so as to minimize any possible tool error and any local perturbations on the wing surface and in order to offset/cancel the effect of skin thickness on the top and bottom of the airfoils when compared to the scanned templates. To illustrate the method, Figure 3 below shows a graph of the left and right wing measurements taken BL50 on Q-200 N17PF and compared to the "virtual" template measurements. The incidence on this graph (vertical axis) shows the angle relative to the plan template level-line. The incidence angle of the left wing (blue) is about 10.25 degrees and the right (red) is about 10 degrees. Thus, the right wing has about 0.25 degrees lower incidence than the left wing. This difference should result in a slight right-rolling tendency. For purposes of this study, where left and right wing
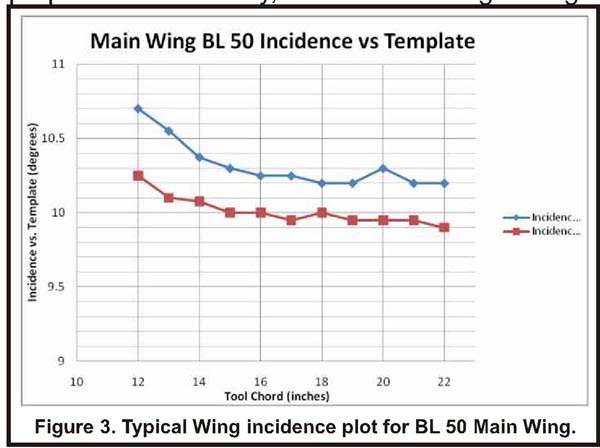
incidence angles are measured, they are averaged to provide a single incidence number. In the case where only left or right side was measured, the plane is assumed to be symmetrical.
The fact that the curves in Figure 3 are not flat indicates that the airfoil near the leading edge on this aircraft differs slightly from the plans template. The more critical part of the airfoil, with respect to aerodynamics is the rearward of the leading edge, so variations on the left side of the plot are less significant than those on the right. N17PF is a tail dragger with a ground angle of about 7 degrees, so if we were to position the fuselage of N17PF at level, the wing incidence would be about a +3 degrees relative to plans. The decalage angle is the difference between wing and canard incidence angles, so decalage angle is independent of the position of the fuselage as long as wing and canard are measured with the plane in the same position.
A unique plot (like Figure 3) was created for every BL station measure on each wing and canard on each plane measured for this study. In two cases a plane needed to be re-measured because it had been re-positioned on the tarmac before measuring was complete, In these cases the tool reproducibility was assessed by re-measuring wings that were previously measured. It was found that in these cases, there was nearly an exact match in measurements (within the tool reading error tolerance). On this basis I feel very confident that this data accurately reflects the true wing and canard incidence angles (and consequent decalage angles) for the aircraft included in this study.
Performance vs. Decalage Angle
The main objective of this study was to determine if there was a relationship between the cruise performance of the Q-2xx and the decalage angle. To complete this goal of the study, the owners/pilots of these aircraft had to gather some standard performance data for me to evaluate. All pilots acknowledged that this would be a challenge because of differences in power plants, propellers, gear type, etc.
Nevertheless, all were kind enough to gather the data for me to use here. My persistent idea is that the decalage has a large influence on performance, so I persisted in my analysis with the numbers provided. I asked each pilot to provide measurements of Calibrated Airspeed (CAS) measurements taken at 8000' density altitude and 1000 pounds gross weight. I asked for 3 airspeed measurements:
1. minimum CAS for level flight;
2. pitch-buck CAS, and
3. CAS at full throttle.
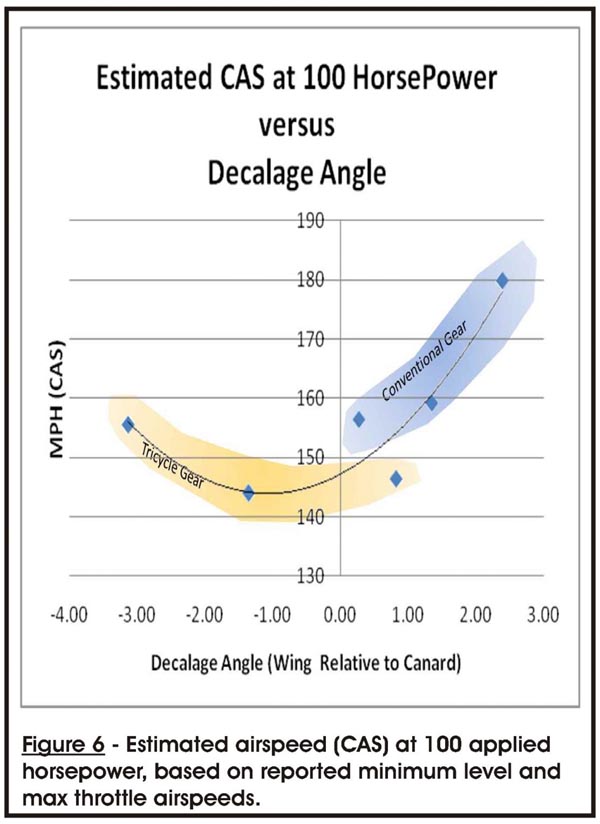
I also asked for engine RPM values at each of these airspeeds and a description of propeller make and pitch, so I could make a rough computation of horsepower and propeller efficiency at each speed. I had to exclude the Type-4 VW powered Q-2 from the horsepower computations because I was unable to locate a power curve data for that particular engine. I did find power curve graphs for both the O-200 and the J-3300 engines (shown in the Appendix). I used the Brake Horsepower (BHP) reference curve in my analysis in order to standardize the analysis and limit the impact of variations in propeller pitch and design. All of the full throttle numbers were close to 100 horsepower which is the point on the power curves where the BHP horsepower and propeller horsepower curves intersect. Given these assumptions and all appropriate caveats, I found that some interesting relationships that appear to define just how much decalage angle impacts performance.

Figure 4 shows the pitch-buck speed as a function of decalage angle for the 7 aircraft (5 O-200, one Type 4 VW, and one J-3300 engines). This plot seems to indicate that by having the main wing fly at a higher angle of attack (relative to the canard), the pitch-buck speed increases. This is probably because the higher relative lift of the wing adds forward pitching moment to the wing-canard combination thereby increasing wing loading on the canard, making the canard stall (pitch-buck) at a higher airspeed and lower angle of attack. On the other end of the spectrum, a main wing which is flying at a much lower angle of attack relative to the canard (negative decalage) decreases the forward pitching moment of the pair, so the canard reaches critical stall angle with less elevator deflection, also resulting in a higher pitch-buck airspeed. It appears that the decalage value balancing these two effects, resulting in minimum pitch buck speed is approximately -1.0 degrees. It is also worth noting that the conventional gear Q's (blue field in figures) have slightly higher in pitch buck speed compared to the tricycle gear (orange field in figures). The overall trend seems to be a higher pitch-buck airspeed the tri-gear (about 5-10 MPH faster), than the tail draggers. This is consistent with past observations & with the expected influence of increased drag on the tri-gear configuration.
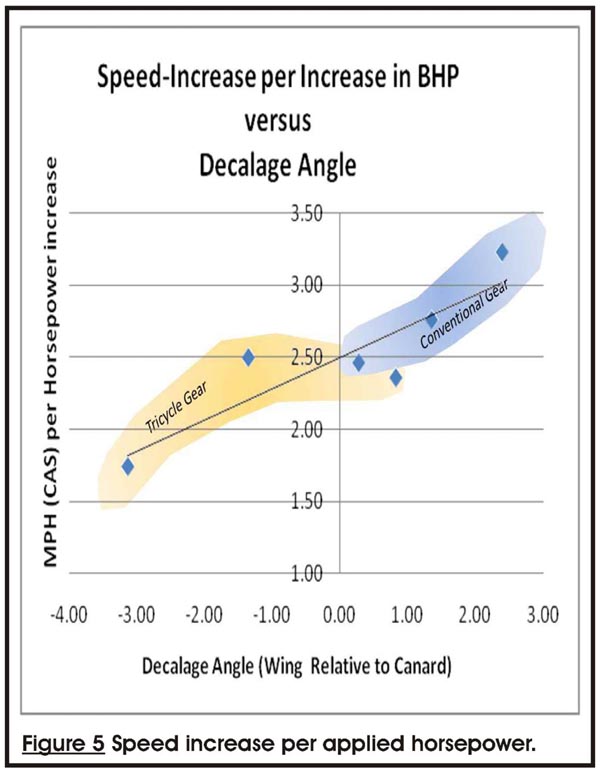
Figure 5 shows the increase in airspeed as a function of additional horsepower applied. The quantity on the vertical axis is computed by dividing the difference in minimum level speed and the max throttle speed by the corresponding difference in horsepower (based on power curve charts). Note that the tail draggers have the edge, but also have higher decalage angles, Where both tail draggers and tri-gear have the same decalage angle, their numbers are comparable. This graph seems to suggests this quantity is more related to decalage than gear type.
In Figure 6 I have computed the calibrated airspeed at 8000' density altitude and 1000 pound gross weight when 100 horsepower is applied. This graph shows a similar pattern to that seen in the pitch-buck speed comparison (Figure 4). It appears that higher decalage angle allows both the main wing and canard to approach a lower combined induced drag at higher speeds, thereby resulting in an overall higher speed with high horsepower. The zero (QAC plan-specified) decalage appears to result in a lower high-power cruise speed, The most negative decalage value (one aircraft only) appears to increase high power cruise slightly (left side of the graph). Note also the offset between the tri-gear and tail dragger trends in figure 6 relative to figure 4. This offset is probably the result of higher parasitic drag of the tri-gear configuration at higher speeds.
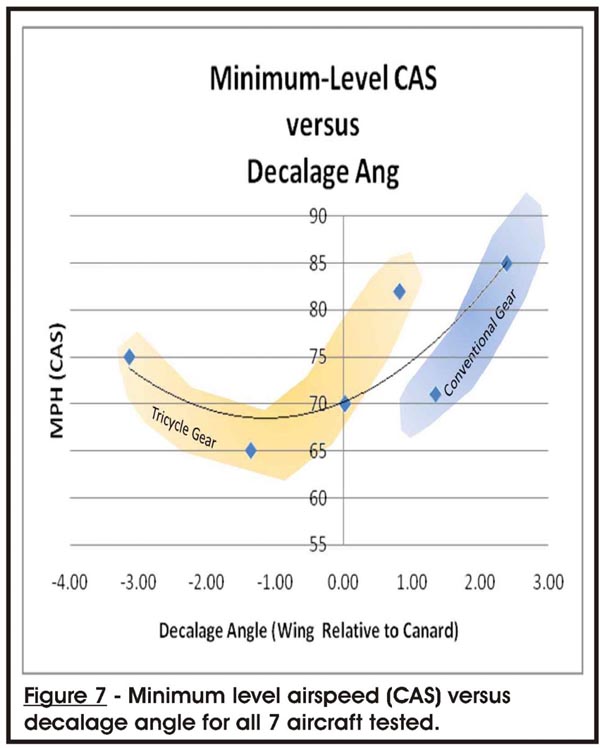
Figure 7 shows the minimum level-flight airspeed as a function of decalage angle. This plot shows a significant difference between the tri-gear and tail dragger trends, probably the result of the tri-gear requiring a lower angle of attack and more power to overcome higher parasitic drag compared to the tail draggers.
Conclusions
From these initial measurements and my interpretation of performance figures, it appears that the Q2xx design will safely accommodate a variation in decalage ranging from at least -3 to +3 degrees relative to the original plans. The original plan design seems to be optimized primarily for minimum pitch-buck speed, rather than maximum cruise (and correspondingly higher pitch-buck and minimum landing speed). The best performance in cruise seems to be achieved at the highest observed decalage angle (approximately +3 degrees). This angle also seems to yield the least induced drag as indicated by the effectiveness of applied power (Figure 5).
As always these conclusions are drawn from results gathered under non-rigorous test conditions are based on a very small sample population with variations in prop-engine combinations and other drag considerations. My conclusions should not be considered definitive and they will probably continue to evolve as I continue to measure more Q's where I find them and add to this study. I will occasionally update these charts and conclusions. Many thanks to the owner/pilots of the aircraft that I tested, and for those of you who are anxious to "decode" just which airplane is which on my graphs, I have included a table with the N-number and its corresponding data. These are located in Table 1* (see note below). Experienced Quickie tail spotters can figure out who is who with respect to owners/pilots.
*I have place two PDF files with a work table and an Appendix that Jay created at the QBA web site under this issue's photos.
Articles from this issue:
Another Useless Accessory HOPEFULLY!! - by Jerry Marstall
Reflections on the Last Q-Talk Issue - by Sam Hoskins and Jim Masal
Moving Forward - by Dan Yager
Parting Thoughts - by Doug Humble
Where was Sam hiding? - by Doug Humble
A current QBA member may have one free ad per issue. It may be a maximum of five lines of type and will be edited to fit space available. Items advertised must be owned by the QBA member. The ad contact must be a member name. Ads will be run for two issues and then the ad must be resubmitted. [EDITOR'S NOTE: Please note that these ads may no longer be valid. They are included here only as part of the online archive.]
To see For Sale ads, please go to: http://www.quickheads.com/forsale.html
Soon you will be able to add and remove your own For Sale ads at the new QBA web site. Dan Yager will alert the Q-List when this happens.
 |
| Merry Christmas Everyone! |
You can order a printed copy of Q-talk #138 by using the Q-talk Back Issue Order Page.